Install Grafana
To install Grafana in either Linux, macOS, or Windows, follow the instructions on the Grafana website (grafana.com/docs/grafana/latest/).Access the Grafana user interface
Perform the following steps to access the Grafana user interface (UI):1
Go to the Grafana UI by browsing to its IP address or domain name. For example, if Grafana is running on your local machine, the URL is http://localhost:3000.
2
Log in with your admin account.
Add and configure a new data source
Perform the following steps to add and configure the new data source:1
In the left menu, go to Configuration > Data Sources.
2
Select [ Add new data source ].
3
Select Prometheus as the data source type.
4
Provide the following details for the Prometheus data source:
- Name: Enter a name for the data source (such as Prometheus).
- URL: Enter the URL of your Prometheus server (such as
http://localhost:9090). - Auth: Select an authentication option based on your Prometheus server configuration.
- Basic Auth: Enable or disable based on your Prometheus server configuration. If your Prometheus server uses TLS (HTTPS), you might need to configure the TLS Auth settings. Here, you must specify the Certificate, Client Certificate, Client Key, and CA Certificates for your Prometheus instance. If you’re unsure about these settings, see the Prometheus documentation (prometheus.io/docs/introduction/first_steps/).
- Other settings you can configure include Alerting,Type and version,Misc, and Exemplars. For help, see the Grafana documentation (grafana.com/docs/grafana/latest/?utm_source=grafana_gettingstarted).
5
Select [ Save & test ] at the bottom of the page when finished.
Create a new dashboard and add a panel to visualize metrics
A Grafana dashboard, a customizable container for panels, is organized and laid out in a grid-like structure. It enables you to visualize, analyze, and track metrics and logs from various data sources in real-time. Dashboards can be interactive, and they serve as a central space for monitoring key data points, displaying performance metrics, identifying trends, and exploring potential issues. A panel, a basic visual element in Grafana, can hold a graph, single stat, table, map, or other types of data visualization. Perform the following tasks to create a new dashboard and panel for visualizing metrics pulled from Prometheus.Create a new dashboard
To create a dashboard, in the left menu, go to Dashboards > New dashboard.This process creates a new dashboard with an empty panel.
Add a panel
On your new dashboard, a text box prompts you to create a new panel or row. Select [ Add a new panel ].This opens the Panel Editor.
Configure the panel
Perform the following steps to configure the panel:1
On the Queries tab, you can configure the panel data source and set up queries. Select the drop-down menu next to Data source and select your Prometheus data source from the list.
2
After selecting your Prometheus data source, you can create your query. In the Metric drop-down list, select the metric you want to visualize in this panel. Optionally, you can configure Label filters as well.
3
Now, select [ Run queries ] to run the query you configured and see the results visualized in the graph on the panel.
Customize the panel
After setting up your queries, you can move on to visualizing the data. Perform the following steps to customize the panel:1
Go to the Visualization tab next to Queries. Here, you can select the type of visualization (graph, gauge, table, and so on) and customize it as needed.
2
Next, select the General tab where you can name your panel and add a description.
3
After you have configured your panel, select [ Apply ] in the upper-right corner.
Save the dashboard
Perform the following steps to save the configured dashboard:1
Select the disk icon in the upper-right corner.
2
The Save Dashboard dialog displays, prompting for the dashboard name and description. Enter these details and select [ Save ].
Sample dashboard
The following image shows an example dashboard with two panels added to visualize latency metrics: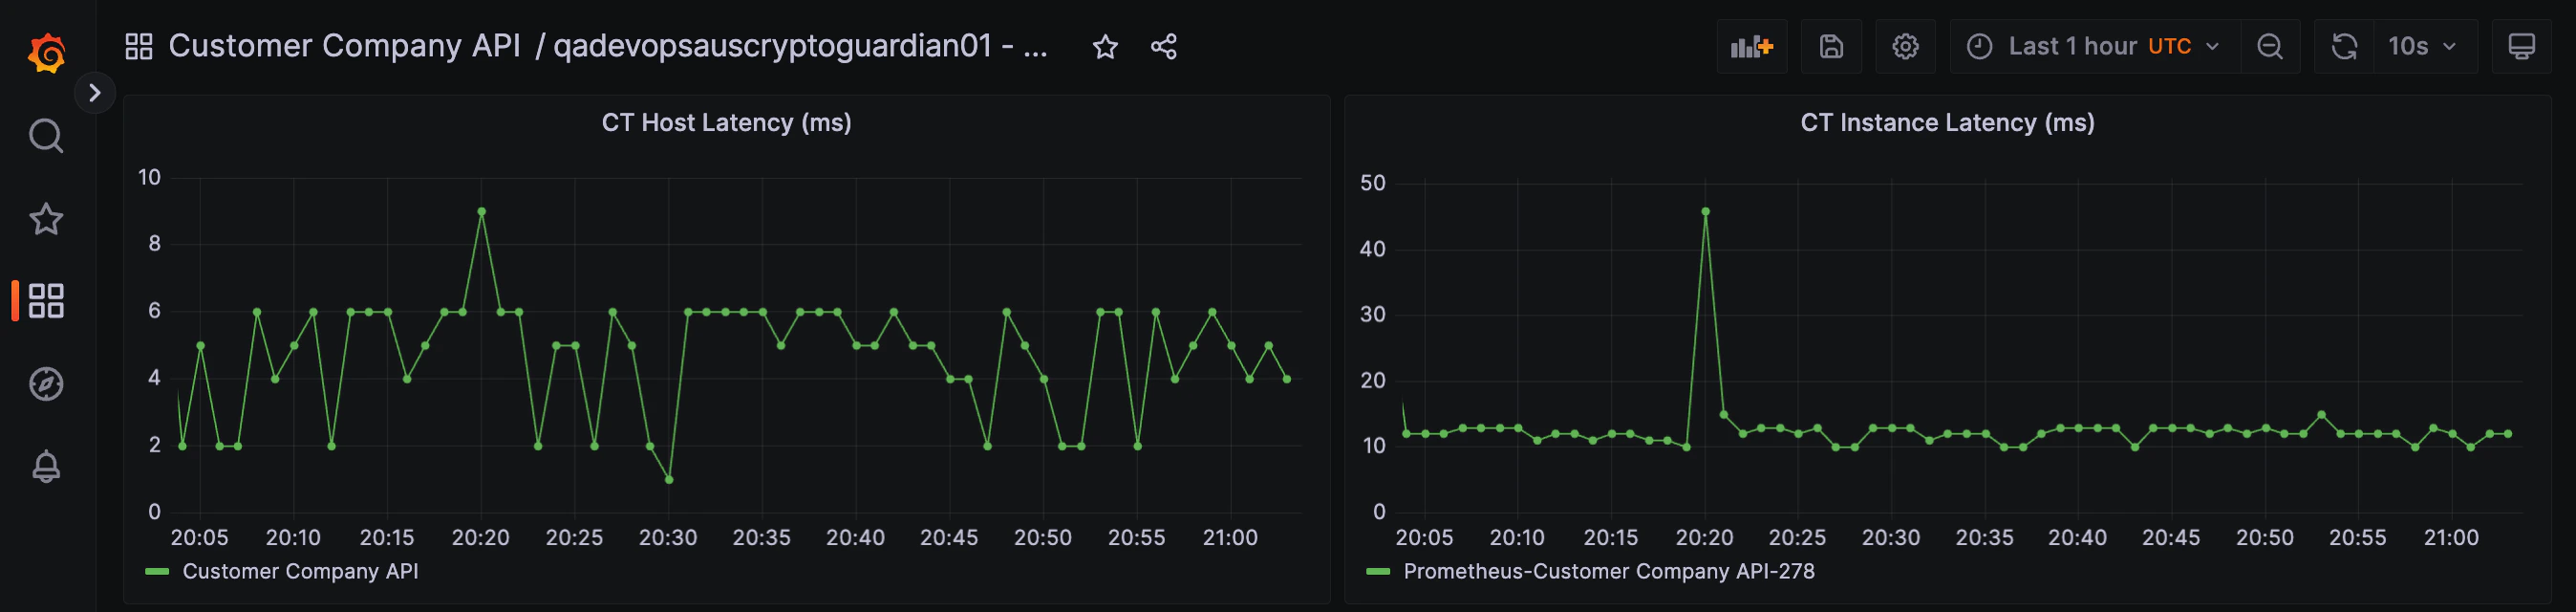
Sample dashboard